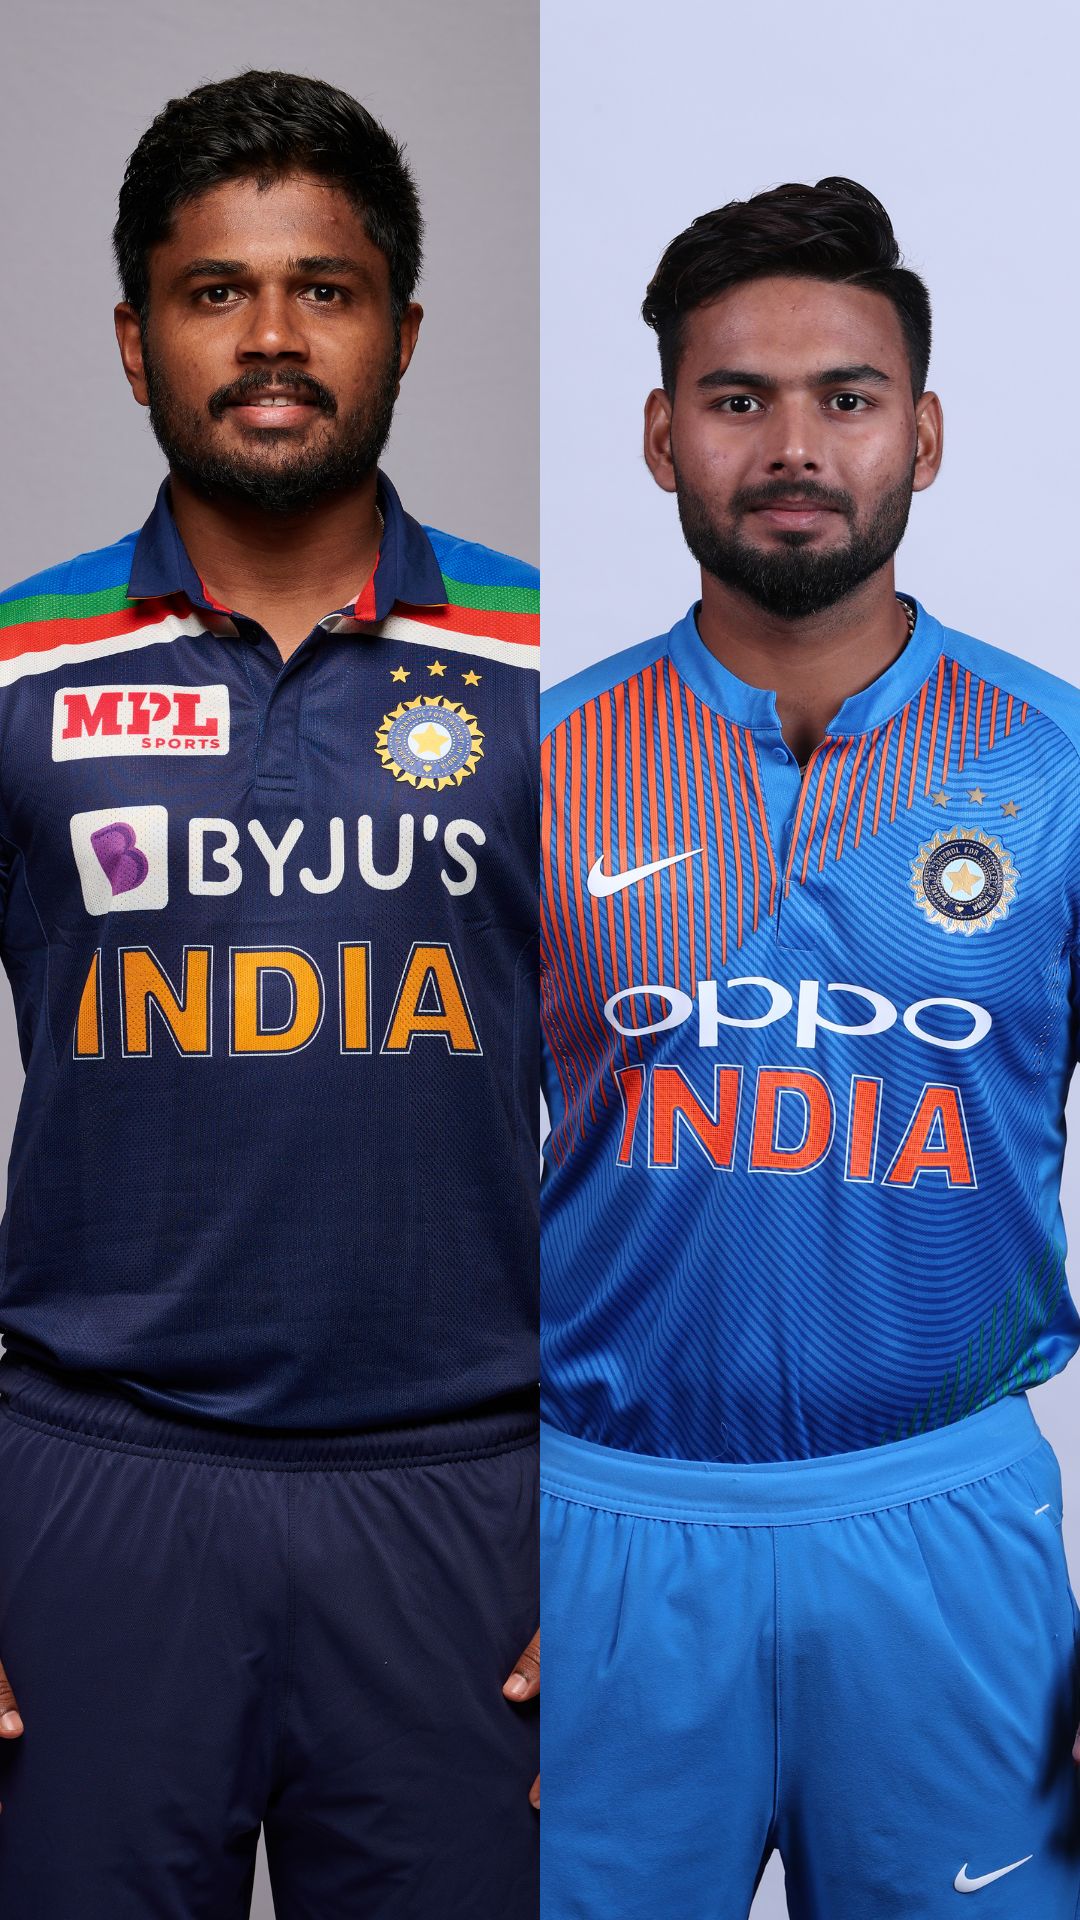
Sanju Samson vs Rishabh Pant - Stats comparison after 31 innings in T20Is
Image Source : GettySanju Samson has scored 701 runs at an average of 25.03 after 31 innings in T20Is.
Image Source : GettyRishabh Pant had scored only 563 runs at an average of 21.65 after 31 T20I innings.
Image Source : GettySamson's strike-rate after 31 T20I innings is 151.07.
Image Source : GettyPant's strike-rate after 31 T20I innings was 121.07.
Image Source : GettySamson has so far hit 2 centuries and 2 half-centuries in 31 T20I innings.
Image Source : GettyPant had hit only 2 half-centuries after 31 T20I innings.
Image Source : GettySamson's career-best score is 111 after 31 innings in T20Is.
Image Source : GettyPant's career-best score after 31 innings in T20Is was 65*.
Image Source : GettySamson has so far registered 5 ducks in T20Is in 31 innings.
Image Source : GettyPant registered 3 ducks in T20Is by 31 innings.
Image Source : GettyNext : Shaheen Afridi goes past Kuldeep Yadav to become number 1 in ODIs