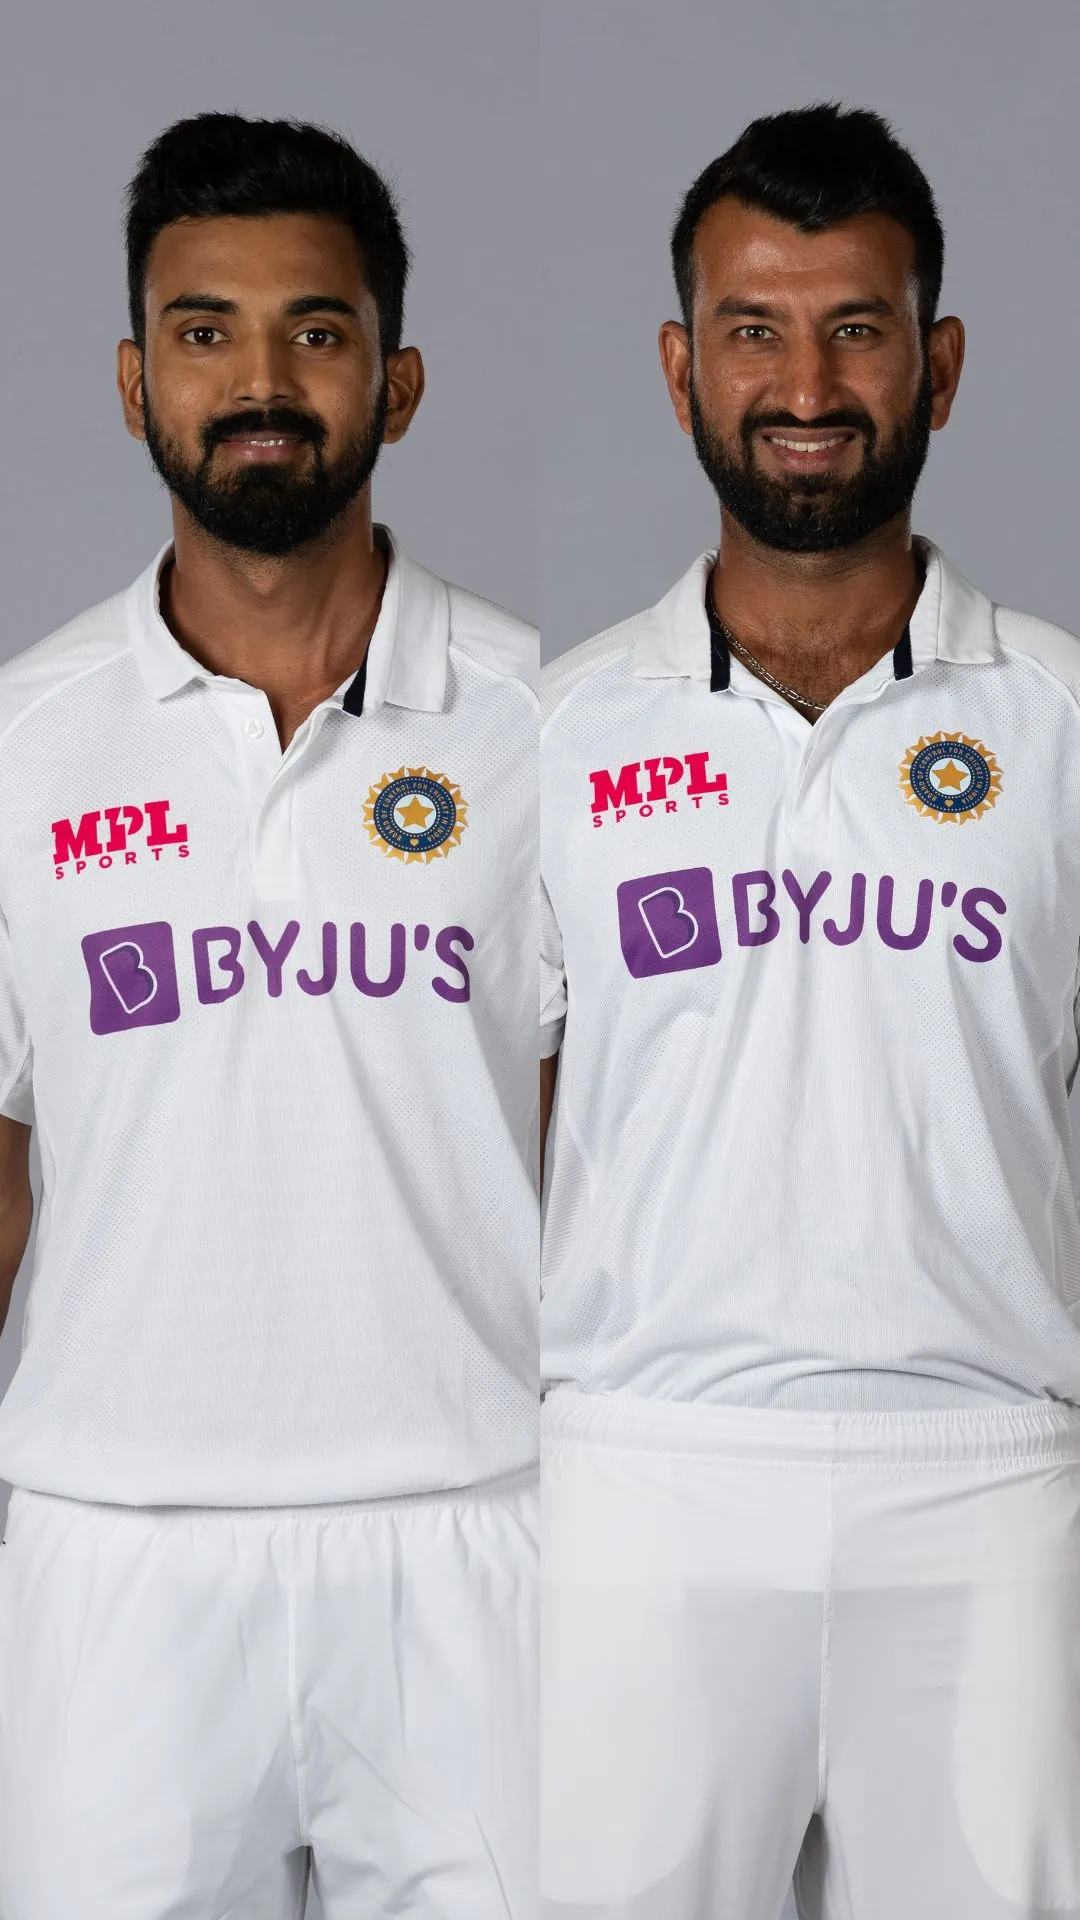
KL Rahul vs Cheteshwar Pujara - Stats comparison after 100 innings in Test cricket
Image Source : Getty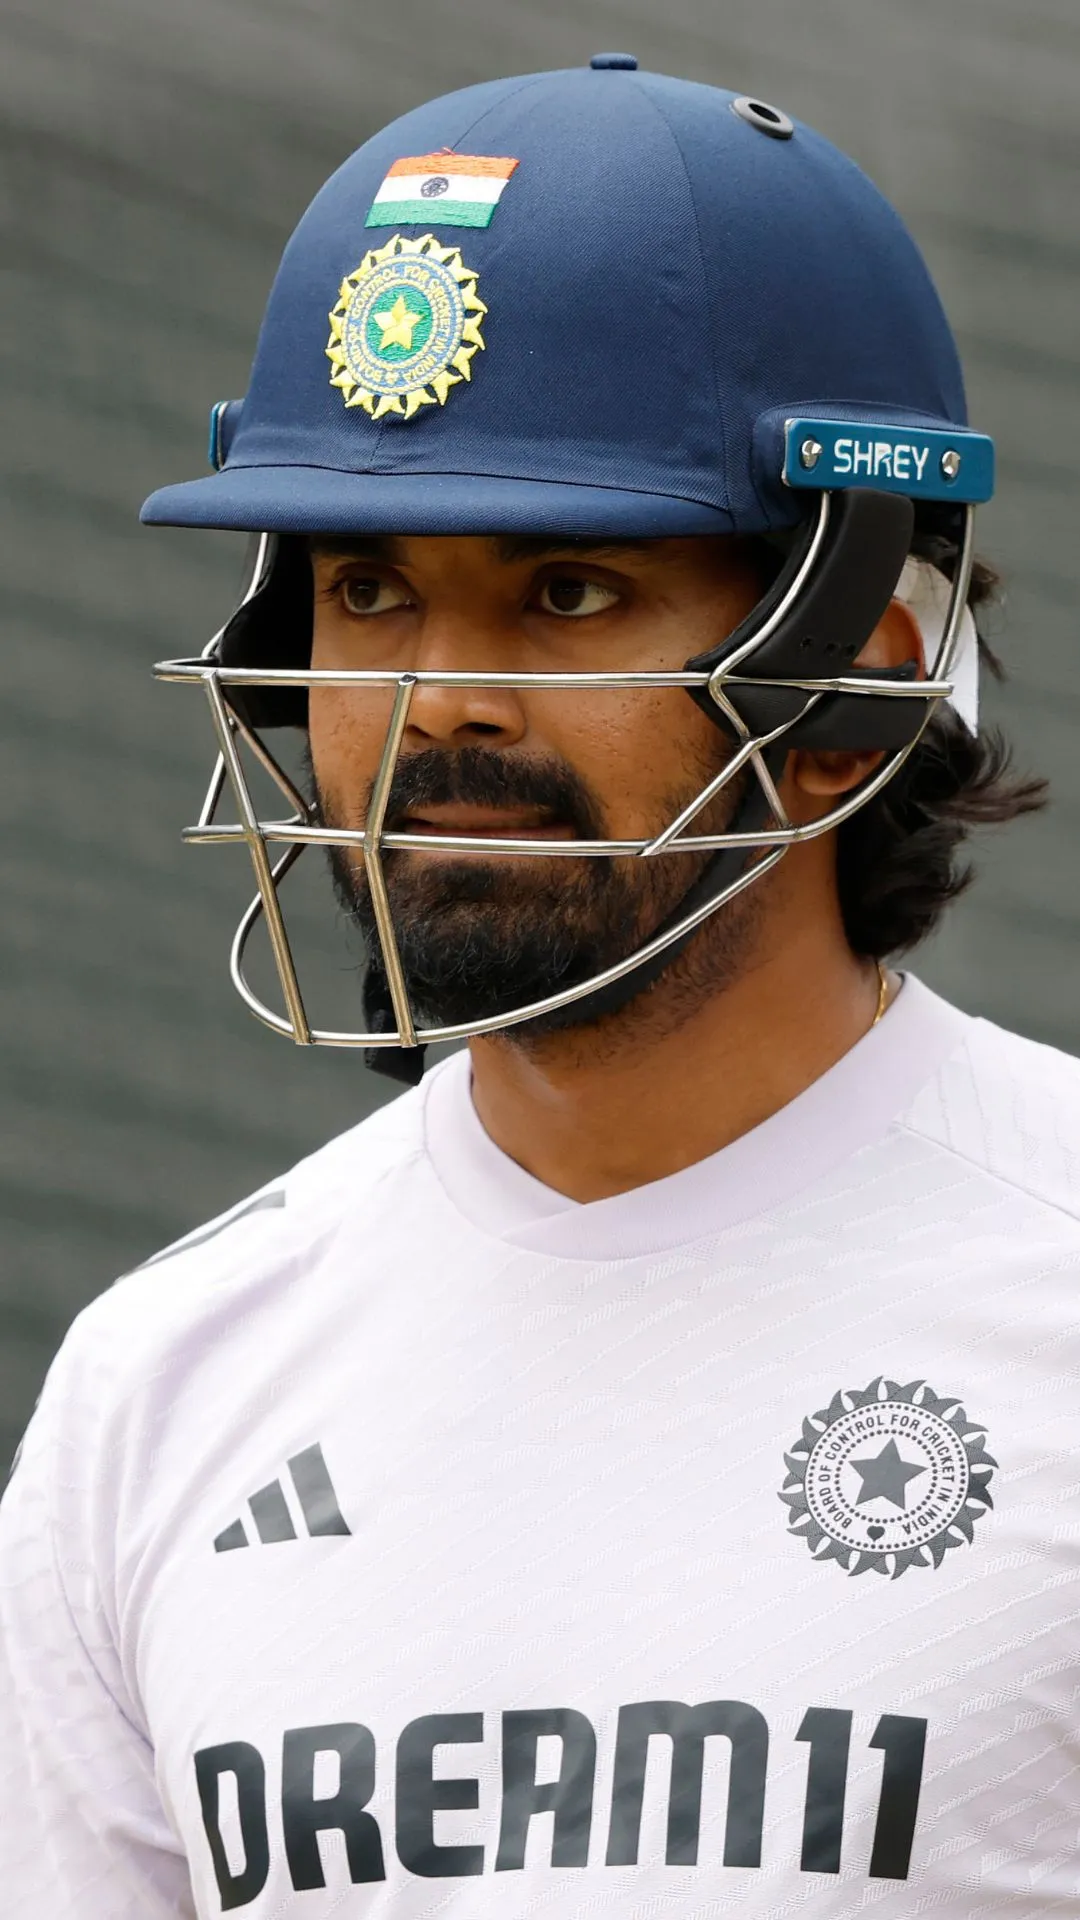
KL Rahul has so far scored 3257 runs at an average of 33.57 after 100 Test innings
Image Source : Getty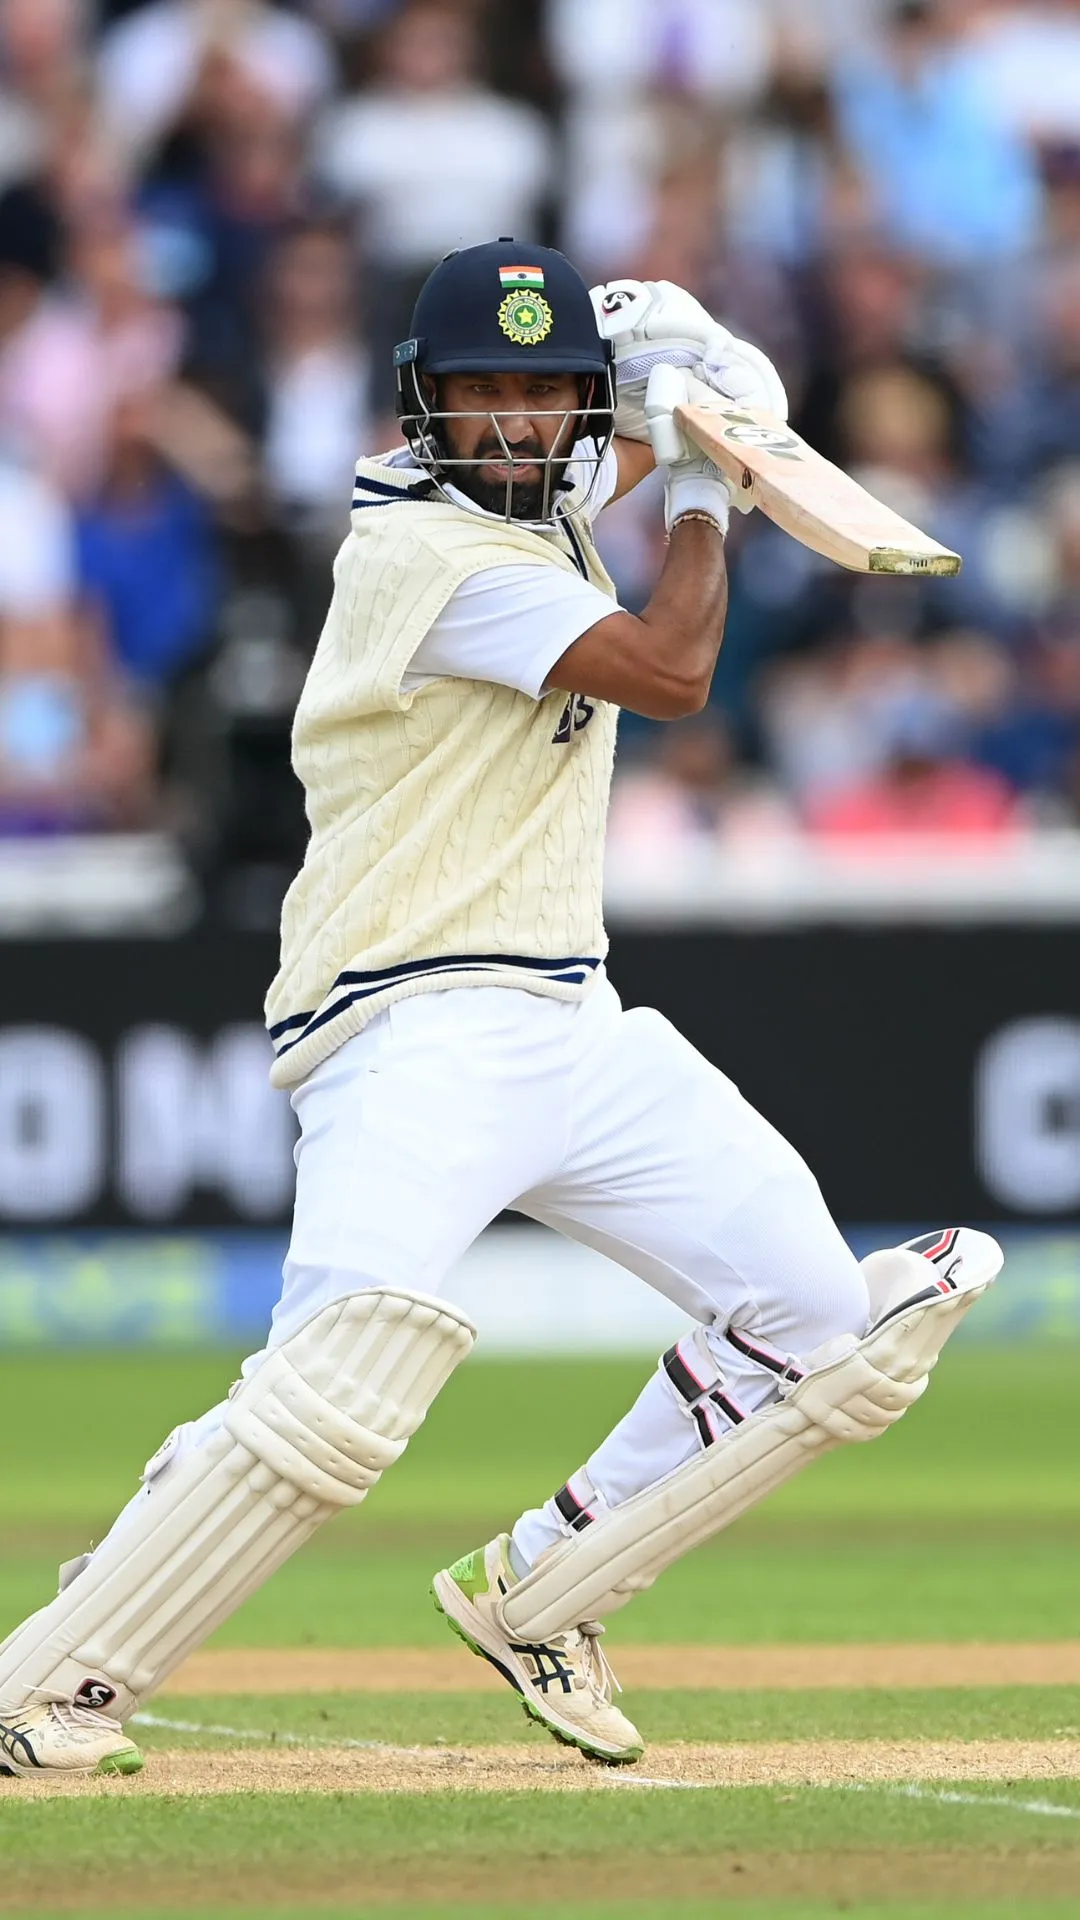
Cheteshwar Pujara scored 4635 runs at an average of 49.30 after 100 Test innings
Image Source : Getty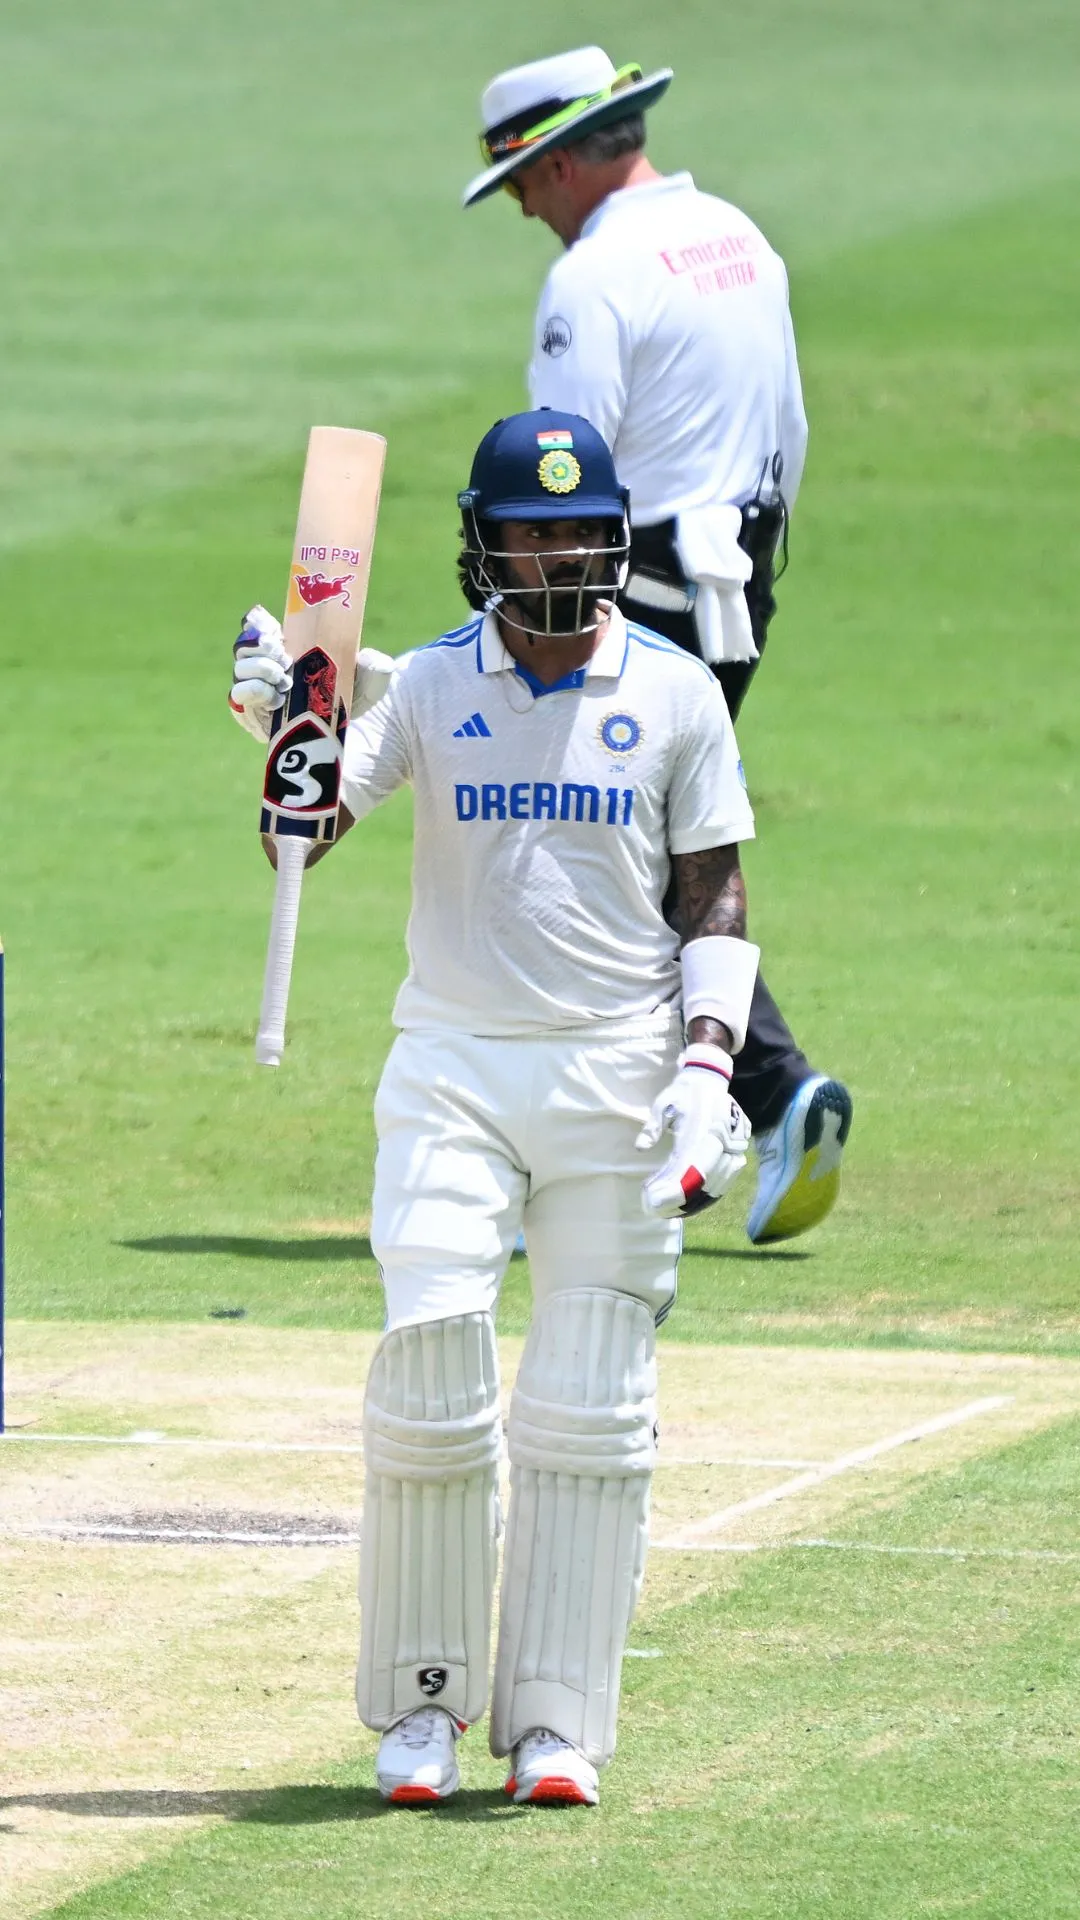
Rahul has so far hit 8 centuries and 17 fifties in his career after 100 innings in Tests.
Image Source : Getty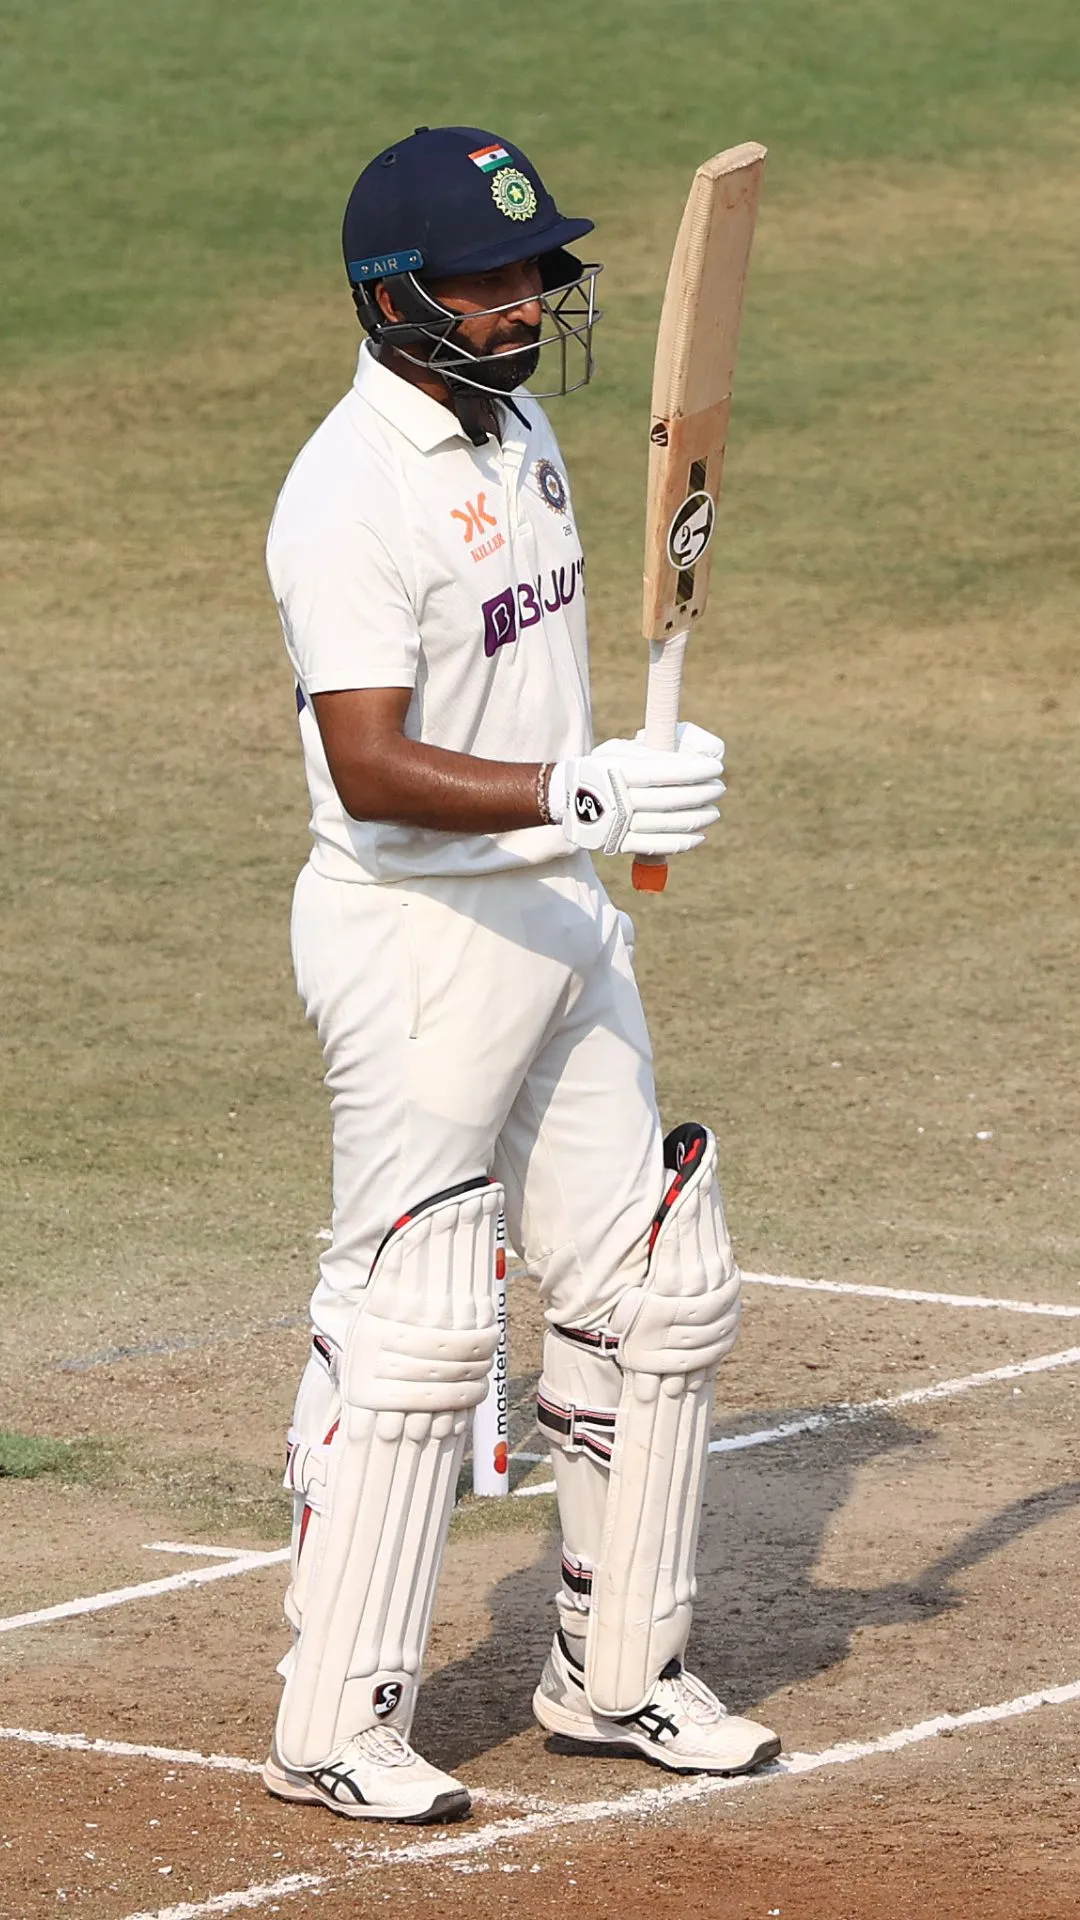
Pujara hit 14 centuries and 18 fifties after 100 Test innings of his career
Image Source : Getty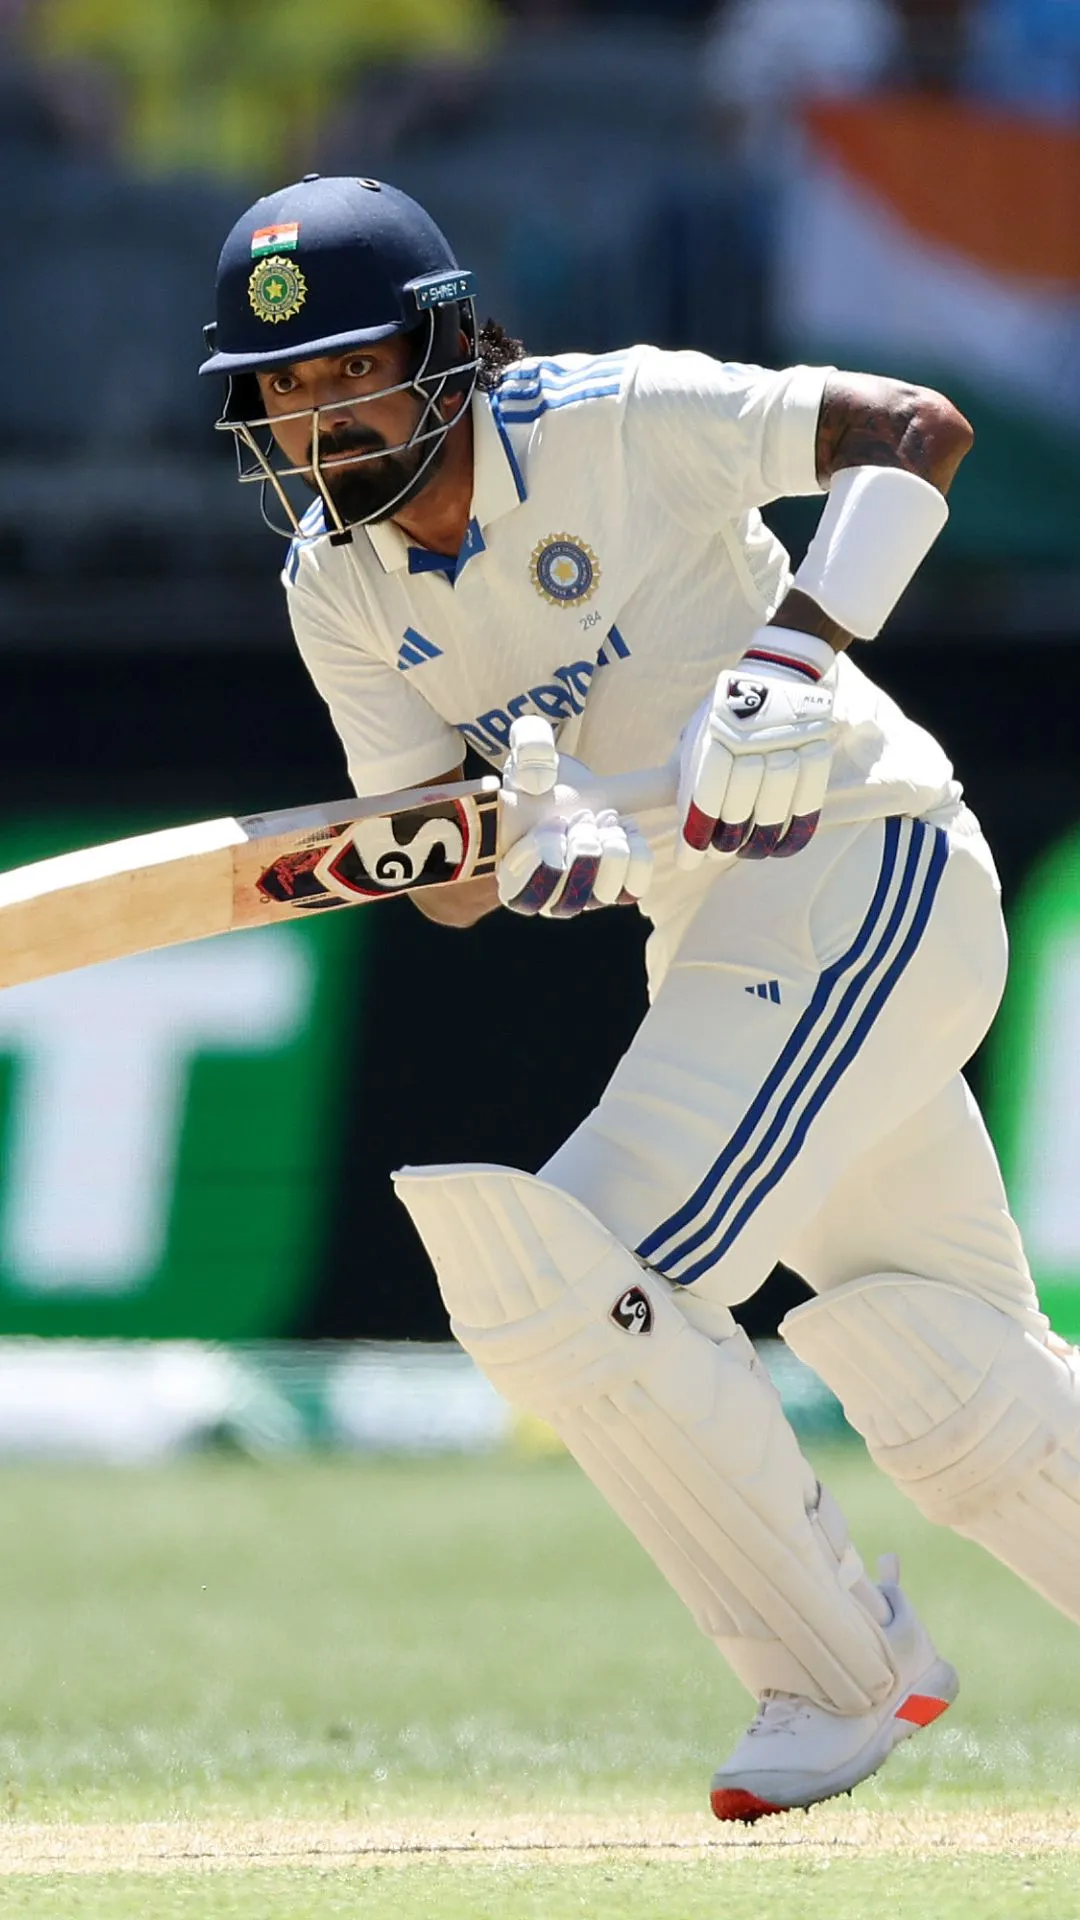
Rahul's best score after 100 Test innings is 199
Image Source : Getty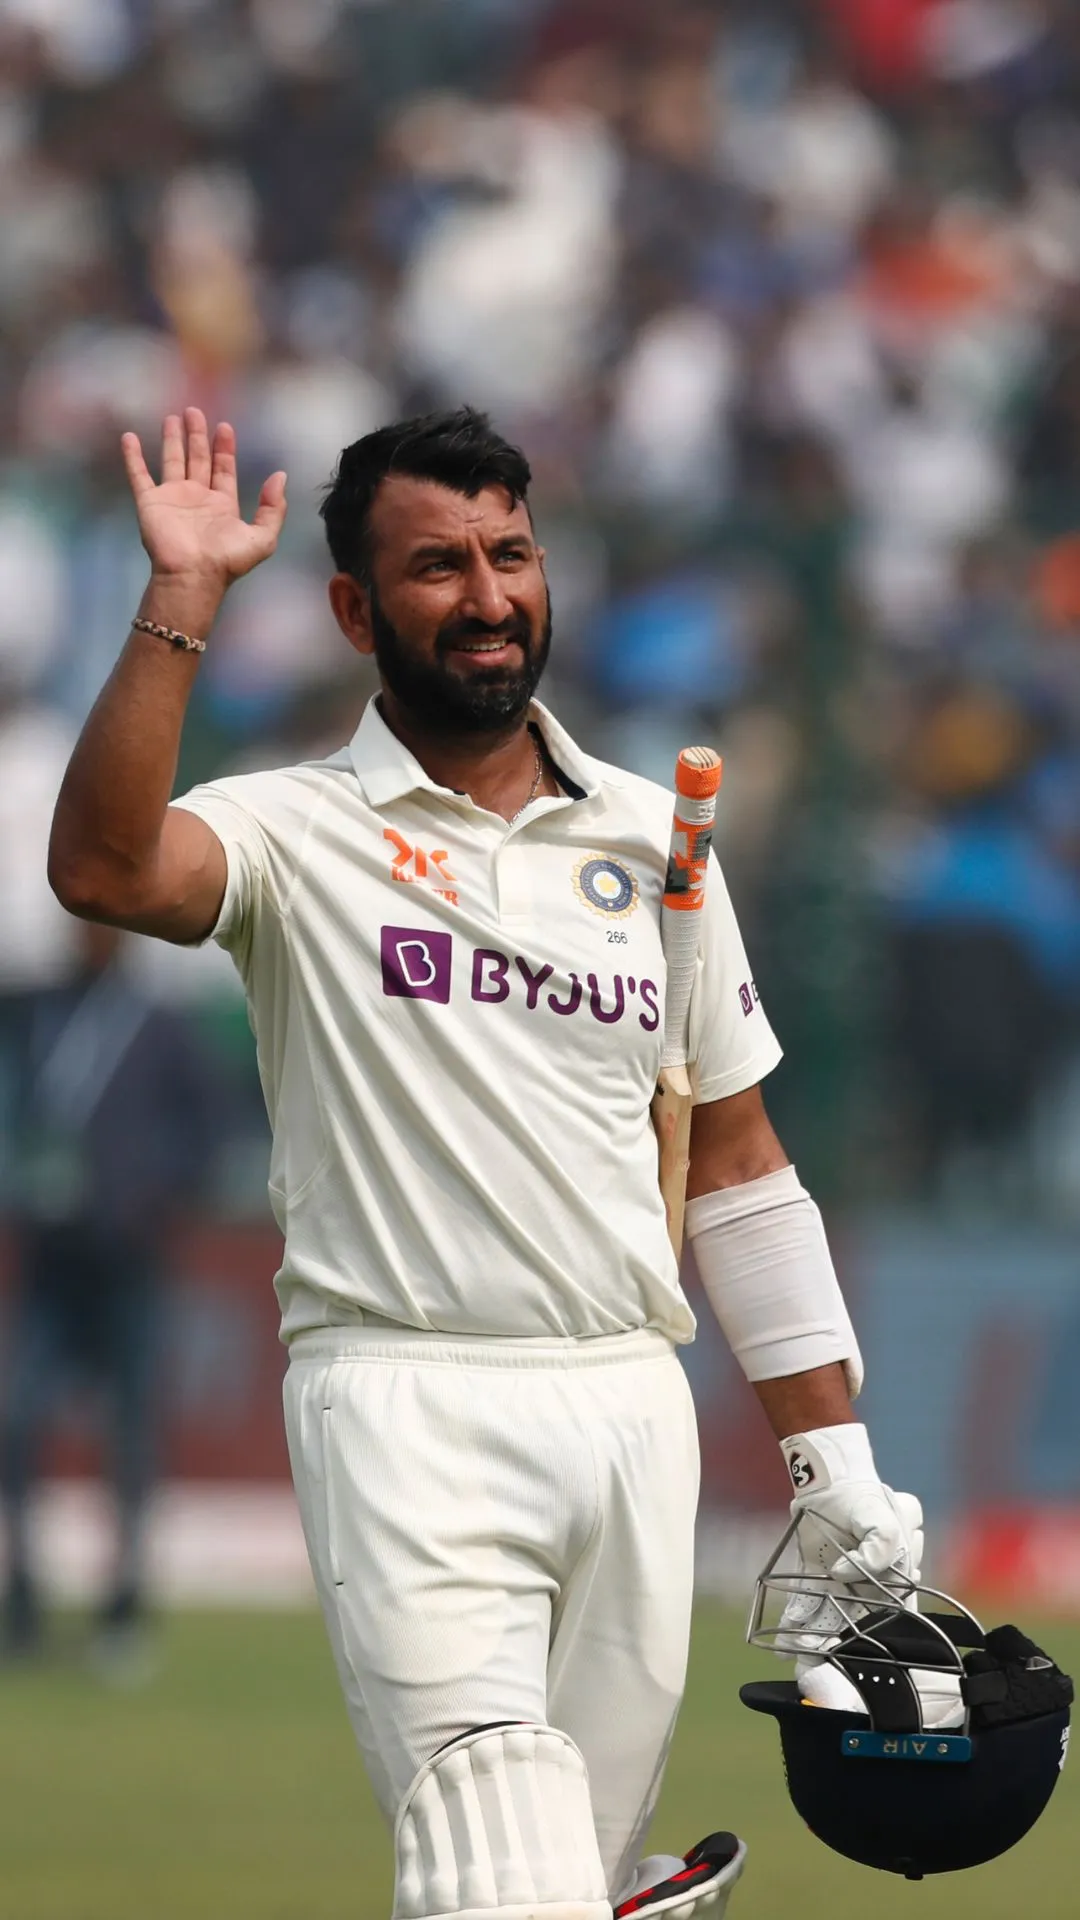
Pujara's best score after 100 Test innings was 206*
Image Source : Getty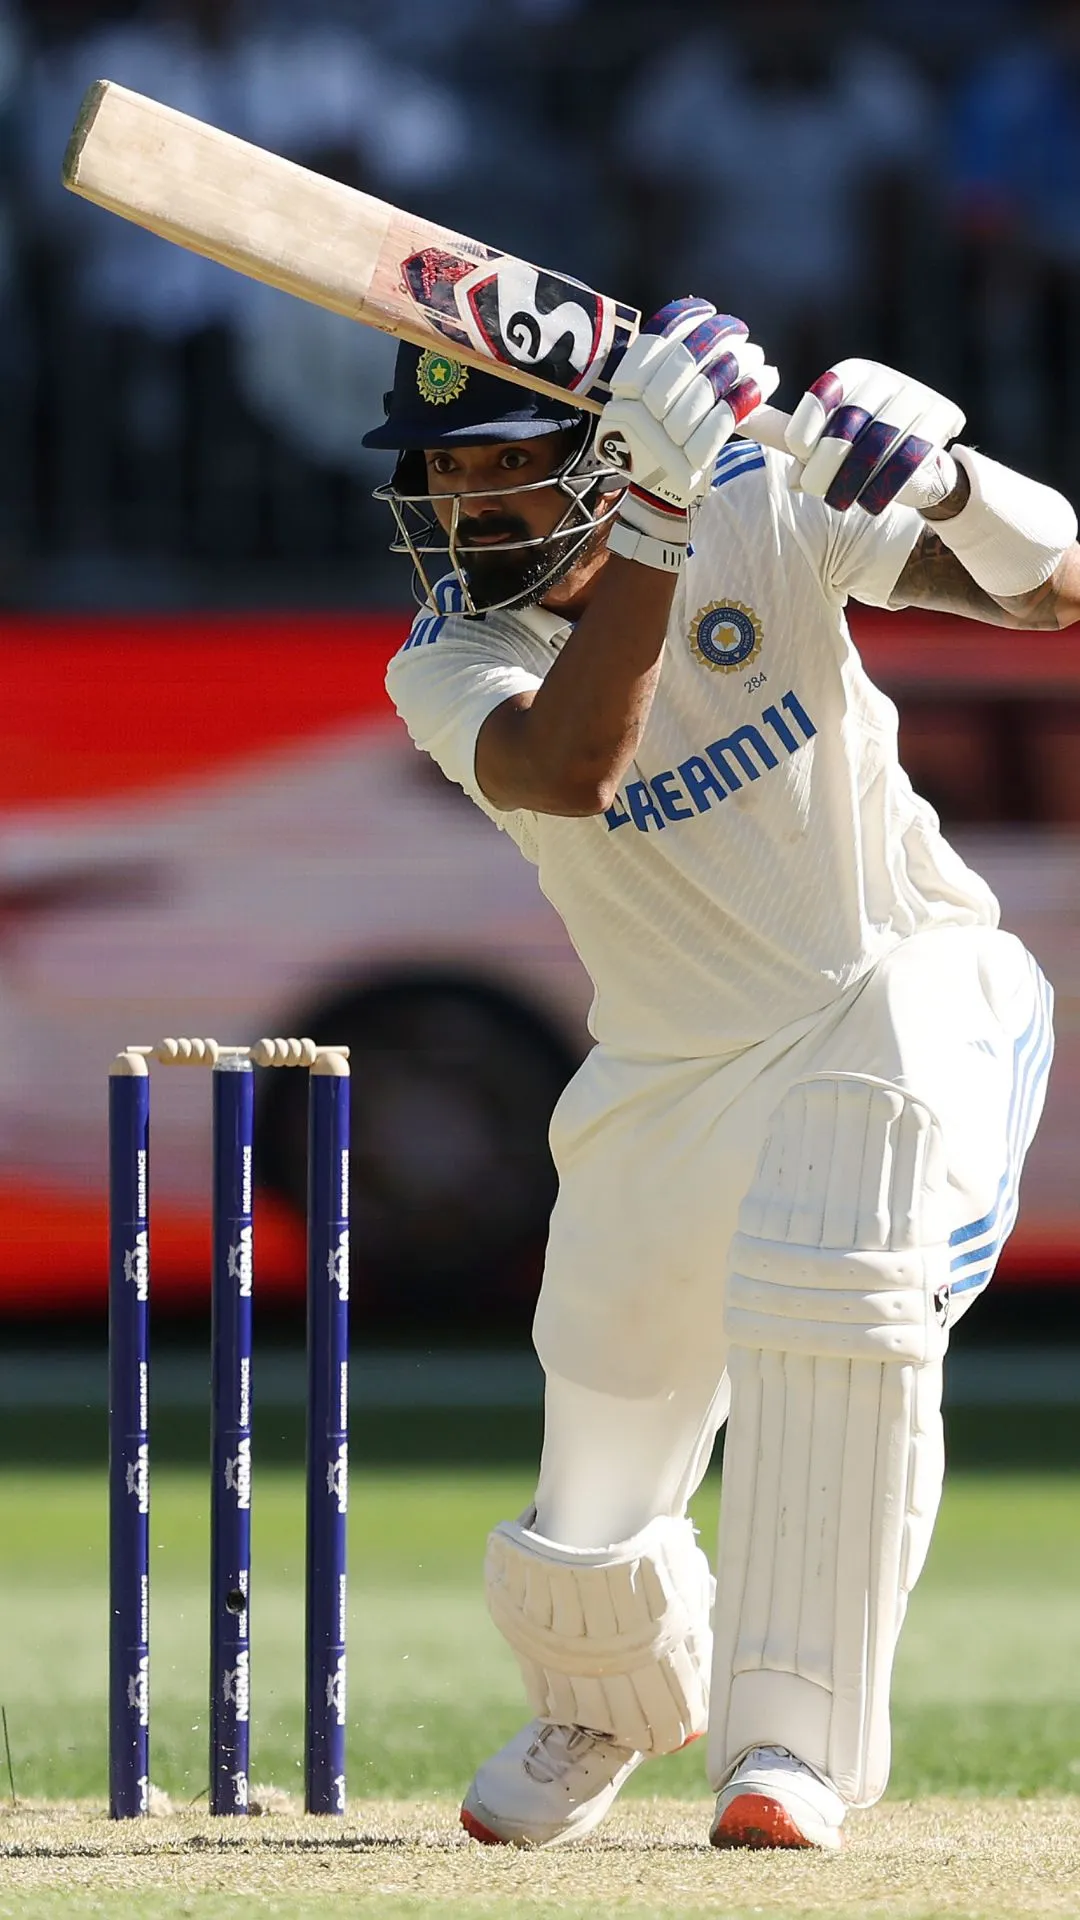
Rahul has faced 6168 balls so far after 100 Test innings
Image Source : Getty
Pujara had faced 9878 balls after 100 Test innings of his career
Image Source : Getty
Rahul has registered 9 ducks after 100 Test innings so far
Image Source : GettyPujara had registered only 4 ducks after 100 Test innings.
Image Source : GettyNext : Jasprit Bumrah vs Ajit Agarkar - Stats comparison after 89 ODIs